Farm Bureau eyes H-2A participation, wages
The end of the calendar year always brings a host of new information about the H-2A temporary agricultural worker program.
In the last two weeks we have learned total fiscal year 2021 participation and the results of the Farm Labor Survey, which is the basis for the 2022 Adverse Effect Wage Rate; and most recently, the Department of Labor published in the Federal Register its proposed rule concerning the methodology used to calculate the AEWR for H-2A workers. This Market Intel digs into the first two bits of news, the third will be covered in another article once we have had a chance to delve into the proposed rule. The comment period for this proposed rule closes on Jan. 31, 2022.
Fiscal Year 2021 – Another Record-Breaking Year
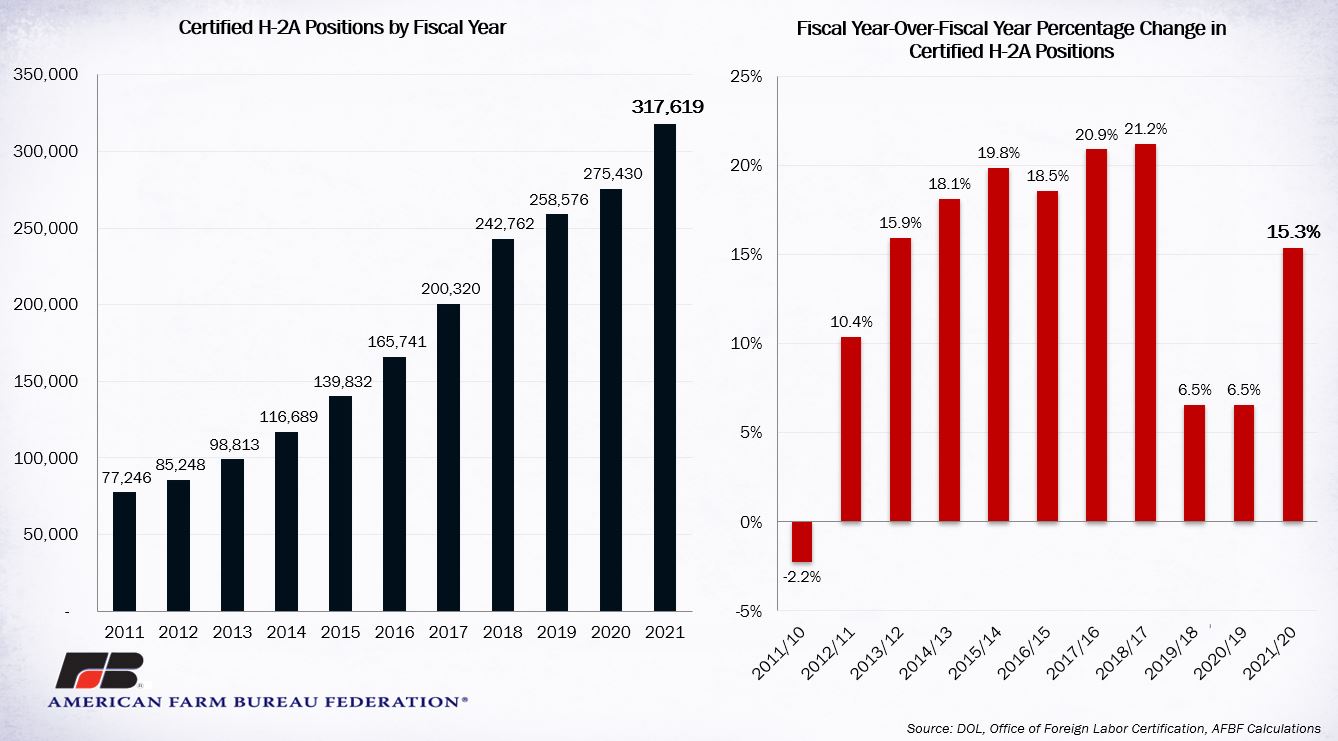
Despite the ongoing global pandemic, fiscal year 2021, Oct. 1, 2020, through Sept. 30, 2021, was a record-breaking year for the H-2A program. There were 317,619 total positions certified by DOL in fiscal year 2021, marking the first time the program exceeded 300,000 positions. On a fiscal year-over-fiscal year basis, the total number of certified positions increased 15.3% in 2021 relative to 2020. This increase was significantly above the 6.5% increases for both 2019-2020 and 2018-2019, but is more similar to the large, double-digit increases earlier in the decade.

Despite the more “normal” double-digit increase in the total number of certified positions in fiscal year 2021, there were some anomalies in the quarter-over-quarter data. In previous years, the largest quarter-over-quarter increases occurred during the first (October through December) and second (January through March) quarters, while the third and fourth quarters have typically had more modest growth. In fiscal year 2021, there was indeed large quarter-over-quarter increases in the first and second quarters, but a small decline in the third quarter (April through June) and then a significant increase in the fourth quarter (July through September). This is likely not a change in program usage, but rather an anomaly relative to an unusual fiscal year 2020, impacted by the emerging global pandemic.
Like the story on total number of certified positions, the total number of applications reached a new record in fiscal year 2021 with 16,374 applications. The average number of positions per application for the fiscal year was 19 — in line with the last six years. This is one indicator that the H-2A program is being used by a similar make up of farms by size and type as the program grows; there are just more farm businesses utilizing the H-2A program. While the average number of applications for the whole fiscal year is steady, there were also anomalies in the quarter-over-quarter averages. These anomalies were also likely a response to travel uncertainties brought on by the global pandemic.

![]()
A good example of the impact of COVID-19-related travel disruption is the case of H-2A workers from South Africa. The U.S. welcomed 4,799, 5,518 and 6,913 H-2A workers from South Africa in fiscal years 2019, 2020 and 2021, respectively. As can be seen in the graphic below, customarily 70-80% of H-2A visas to South Africans are issued in February, March and April. However, in fiscal year 2020, this pattern was disrupted when on March 24, South Africa announced a 21-day national lockdown, resulting in a halt to visa processing. In the chart below, the impact of that lockdown is easily observed. In April 2020, there were only 87 H-2A visas issued, when in April 2019 and April 2021, there were 1,145 and 1,761 H-2A visas issued, respectively. It is also clear that the workers are specialized — for the most part, their arrival was not postponed until later in the year because they were coming to the U.S. to assist specific farms with specific crops, as they do every year.

![]()
With the release of USDA’s Farm Labor Survey on Nov. 24, farmers who utilize the H-2A program now know the Adverse Effect Wage Rate they will pay H-2A workers in 2022. According to the FLS, the annual national average gross wage rate for field and livestock workers, which is the figure used for the AEWR, was $15.56 in 2021, up 94 cents, or 6.4%, from $14.62 in 2020. By comparison, according to the BLS’ Employment Cost Index, nationally, wages and salaries for private industry workers increased 4.6% for the 12-month period ending in September 2021.

![]()

![]()
While this is interesting, what really matters for the H-2A program are the regional annual average gross wage rates for field and livestock workers, which serve as the basis for the AEWR. As has been the case for several years, the rate of change from region-to-region varied considerably in 2021. The Northeast II region (Delaware, Maryland, New Jersey, Pennsylvania) had the largest increase — jumping $1.49/hour, or 10.6%, above 2020. Meanwhile, wages in the Mountain I region (Idaho, Montana, Wyoming) had the smallest increase — 13 cents/hour, or 0.9%, above 2020. Eleven of the 18 regions in the FLS exceeded the ECI’s 4.6% increase. Hourly AEWR wages now exceed $12/hour in all regions except the Southeast ($11.99).

![]()
The long view
The sizable 6.4% single-year increase for 2022 comes on the heels of several years of considerable AEWR increases. Over the last five years, the national average AEWR has increased by 28%. Again, regional wages are what really count. From this perspective, depending on the region, wages have increased between 12% and 42% over the last five years.
— Veronica Nigh, senior economist, American Farm Bureau Federation