The relationship between potato tuber yield and thermal stability
In 2011, the Michigan potato industry identified soil health as a key research priority. The following year, it published an informational document (white paper), sponsored a workshop and conducted a soil survey on this topic.
The survey included 96 commercial potato fields. Soil samples from the survey were sent to the Cornell University Soil Health Laboratory, where they were analyzed for four physical, four chemical and four biological soil health indicators.
On a scale of 0-100, the average soil health of the 96 fields was 57.7. Fields with high scores had crop rotations of three years or longer. The site with the highest score had five different cash crops and two cover crops in a five-year rotation. This research was followed by a more comprehensive study from 2014-17, and a commercial potato field from the project was selected as the basis for this article on the role of thermal stability as a soil health indicator.
Thermal stability is a new concept developed by Basso Laboratory at Michigan State University. It is designed to capture the spatial and temporal variation of plant canopy temperatures. Canopy temperature differences are measured using thermal cameras mounted on drones, fixed-wing aircraft or satellites throughout a growing season or over multiple years. For example, an area of a potato field identified as “hot and stable” describes an area where potato plants canopy temperatures were higher than areas described as “cold and stable.” The adjective “hot” indicates higher temperatures, while the adjective “stable” indicates the constant response of high temperature through time; opposite behavior applies for areas identified as “cold” (cooler temperature).
The areas depicted as unstable are the result of plant canopy temperature that varies from one image to the next. On some dates, plants in those areas had high temperature, while on another day they were cooler than the mean temperature of the field. Unstable zones are also generated across years. The thermal stability concept has proven to be useful and correlates well with yield stability research by Maestrini and Basso.
Maestrini and Basso found that identifying and understanding yield stability differences between fields was of significant economic and environmental importance. They suggested that tailoring crop management to the assessed stability of a field could potentially improve yields or reduce input costs and environmental impact.
The usefulness of thermal stability comes from the possibility of using this concept as proxies for soil water availability in response to soil depth and texture difference across the field. Hot and stable plants can be an indication of plants signaling that they have inadequate soil water availability to satisfy the plant’s evaporative demand or a poor foliage system development due to root-lesion nematodes or soil-borne fungi.
The thermal stability analysis process generates maps to capture within-field spatial variability of temperature. This includes all gaseous, liquid and solid matter associated with the field. The technology is sensitive to variation in soil properties, such as aggregate stability, organic carbon and soil depth, nutrient deficiencies, insect pest problems and infectious diseases.
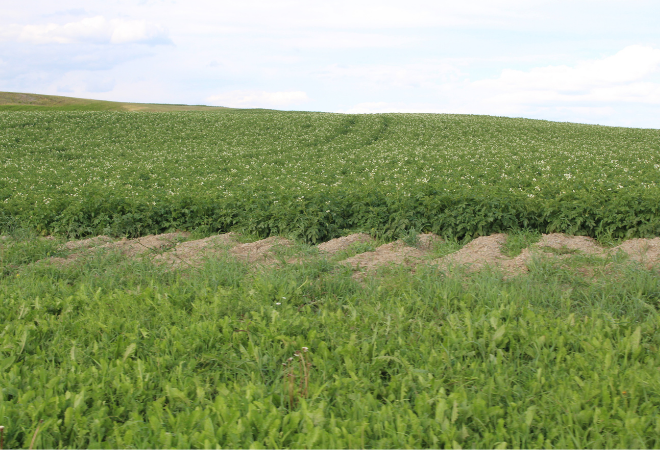
A 2017 thermal stability map was generated for a 54-acre commercial potato field in Mecosta County, Michigan. It had been selected for a 2014-17 soil health research project because of its presumed uniformity. In 2014, the field was divided in half on a north-south axis. Each half was planted to different cover crops in 2014 and 2016 and potatoes grown in the entire field in 2015 and 2017. Five geo-referenced points were established in each half for hand-dug tuber yields and samples for multiple soil health indicators.
In 2017, fixed-wing aircraft were used for remote sensing of temperature stability and crop growth/development. This process consisted of nine fly-overs using the Basso Lab suite of sensors. The first flight took place prior to potato planting and the final flight after potato harvest. Images from the nine flights were integrated into a single thermal stability map (see Figure 1 below) consisting of the following four categories:
- An unstable temperature regime represented on the map by yellow.
- A cold and stable temperature regime represented by blue.
- An intermediate and stable temperature regime represented by green.
- A hot and stable temperature regime represented by red.
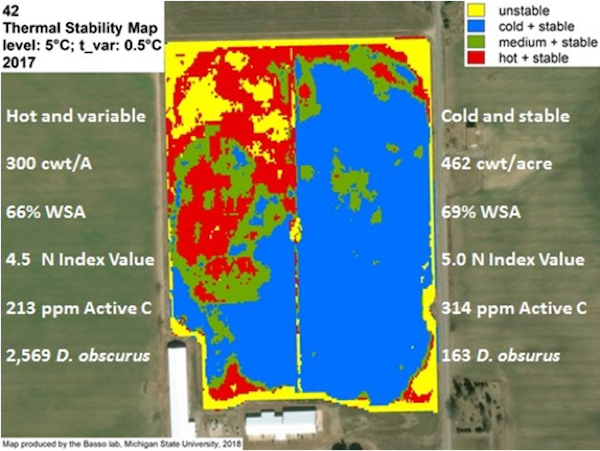
The thermal stability map indicated that the east half of the field was predominately cold and stable and the west half hot and variable.
In 2017, the average tuber yield from the five geo-reference points used for the tuber yield digs in the cold and stable east half of the field was 462 cwt per acre. The average tuber yields from the five geo-referenced points used for the five yield digs in the hot and variable west part of the field averaged only 300 cwt per acre. The soil health indicators of percent water stable aggregates, nitrogen mineralization potential and active carbon were all greater in the east half of the field that had the higher tuber yield and cold-stable thermal stability, compared to the west half of the field with the lower tuber yield and hot-variable thermal stability.
In addition, the population density of the omnivore nematode Dorylaimus obscurus was very high in the hot-variable west portion of the field and relatively low in the cold-stable east half of the field.
Based on these results, it is obvious that the 54-acre site did not have uniform soil health properties and the two halves of the field had most likely been managed differently in the past.
| Soil Health Indicators | Hot & Variable (West 27 acres) | Cold & Stable (East 27 Acres) |
| Tuber Yield | 300 cwt/A | 462 cwt/A |
| Active Carbon | 213 ppm | 314 ppm |
| Nitrogen Mineralization Potential | 4.5 N index | 5.0 N index |
| Water Stable Aggregates | 66% | 69% |
| Dorylaiminus obsurus, Nematoda | 2,569/100 cc soil | 163/100 cc soil |
This research indicates that thermal stability has potential for use as a soil health indicator in association with other tests currently employed to access soil health. Thermal stability assessment is currently being studied in greater detail in other Michigan State University potato soil health research.
In addition to the use of soil health indicators for identification of site-specific soil health issues, a challenging part of the soil health domain is to develop the technologies necessary to prevent soil health degradation, maintain optimal soil health and renovate soil with poor soil health characteristics.
In combination with future research findings and improved potato production digital decision support tools, thermal stability and yield stability maps should contribute significantly towards successful resolution of this challenge. It is hoped that when a future Michigan potato soil health survey is undertaken, the mean soil health score will have increased significantly from a score of 57.7 to a score greater than 80.
The authors would like to thank the Michigan Potato Industry Commission, Sackett Potatoes of Mecosta County, Michigan and the Cornell University Soil Health Laboratory for their support and assistance with this soil health research project.
— George Bird is a professor emeritus at Michigan State University’s Department of Entomology. Bruno Basso is a professor at MSU’s Department of Earth and Environmental Sciences. Richard Price is a research assistant at MSU’s Department of Plant, Soil and Microbial Sciences. Mark Otto is the owner of Agri-Business Consultants in Lansing, Michigan.
(This article was generously submitted to Spudman by the Potato Association of America. More articles from the PAA can be found here.)